Case Study

industry

The automotive industry has a strong tradition in Slovakia and became the most important sector and driving force of the Slovak economy. Over the past 20 years it has been an important source of foreign direct investment.1

gdp

Accounts for nearly 50% of industrial GDP.2 The automotive industry weight on the total industrial export of Slovakia is about 40%.1 The volume of industrial export generated by the automotive industry is up to 26Bn.-€.1

jobs

It's about 10% of the country's wokrforce 3. 250.000 people employed directly and indirectly by the automotive industry 4, of which 130.000+ people employed directly by the 4 car producers VW, PSA, Kia, Jag. & Tier 1 suppliers.1

Policy

Investment incentives: Western Slovakia – 25% of overall eligible costs of the investment; Central and Eastern Slovakia – 35% of overall eligible costs of the investment. Focus on regions with higher unemployment.1

Sources and data

1) Sario, Automotive Sector in Slovakia    /   2) Ministry of Economy of the Slovak Republic, Press release    /   3) Statistical Office of the Slovak Republic, Employed by the Labour Force Sample Survey    /   4) TASR, Press release    /  

"Chronicle of an announced disaster.
A tragedy in three acts."

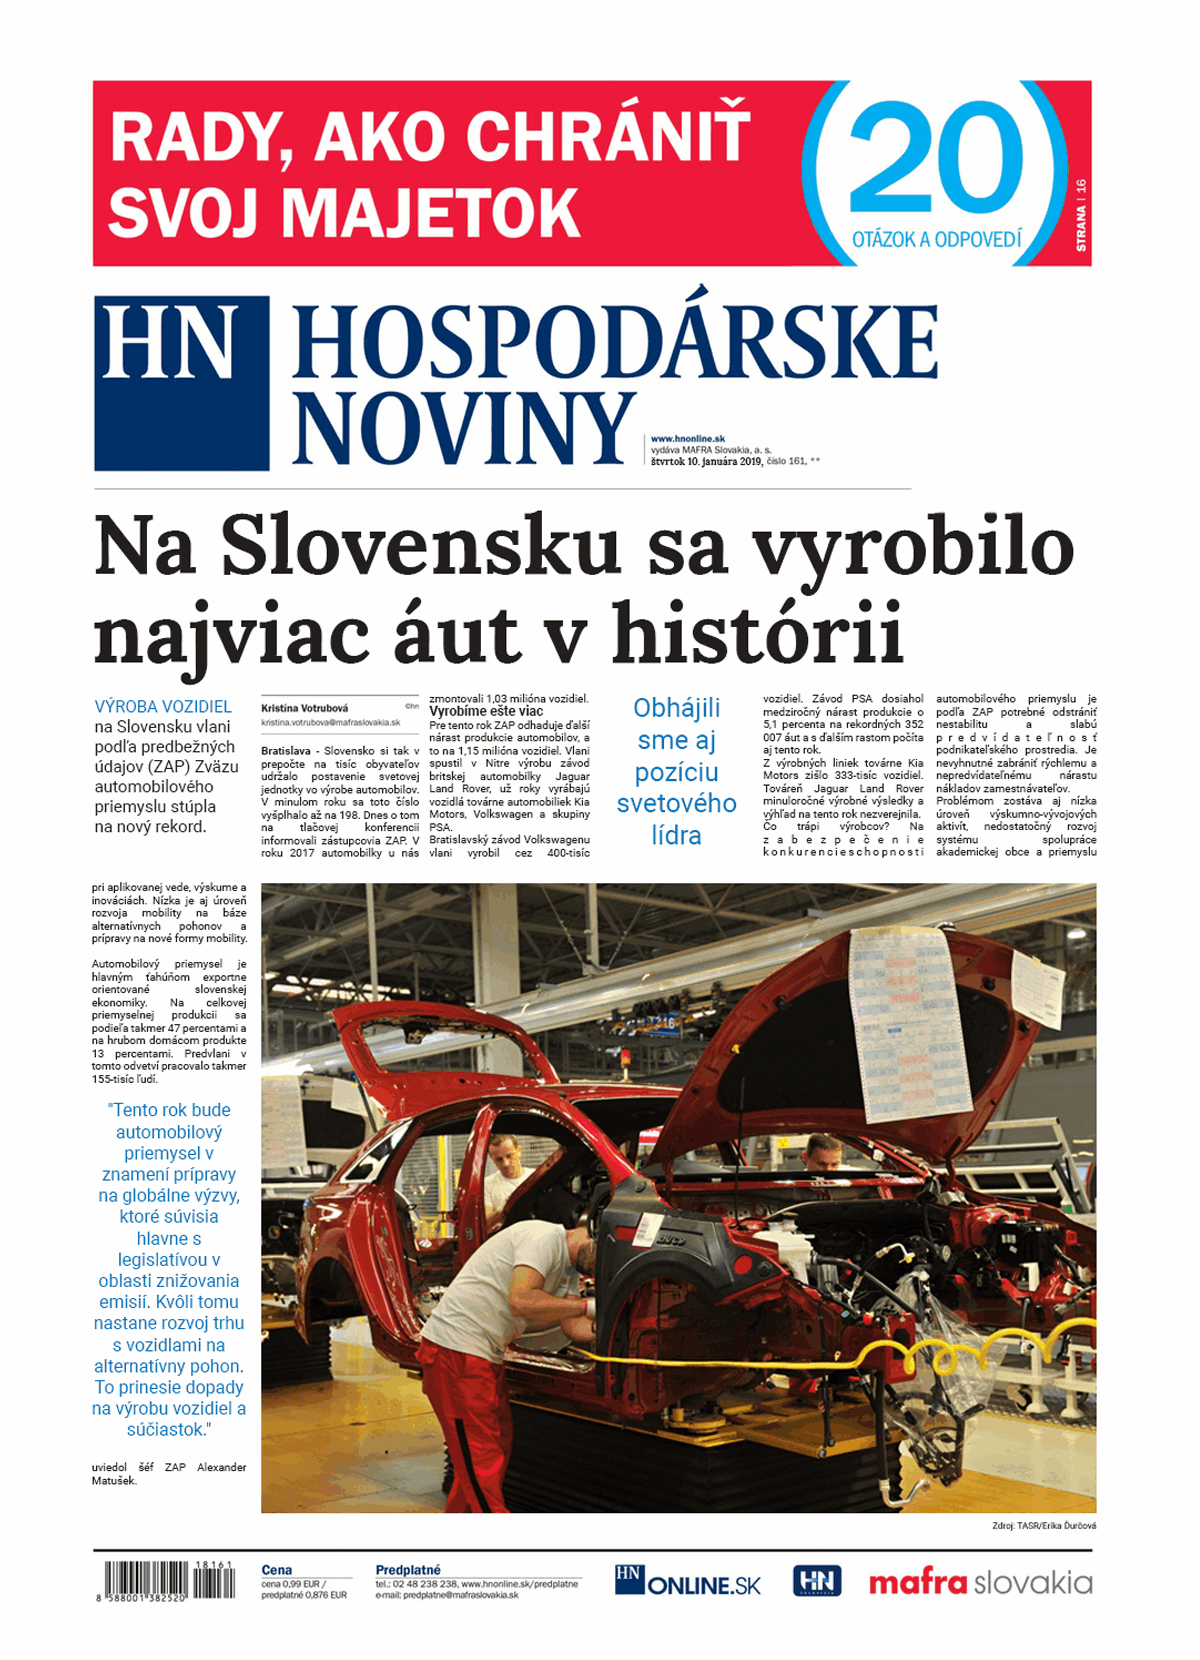
Act 1 - Growing car production

We're the masters of the universe

In Slovakia, more cars have been manufactured than ever before, pushing its car per capita ratio as one of the highest, rising up to 198/1000.

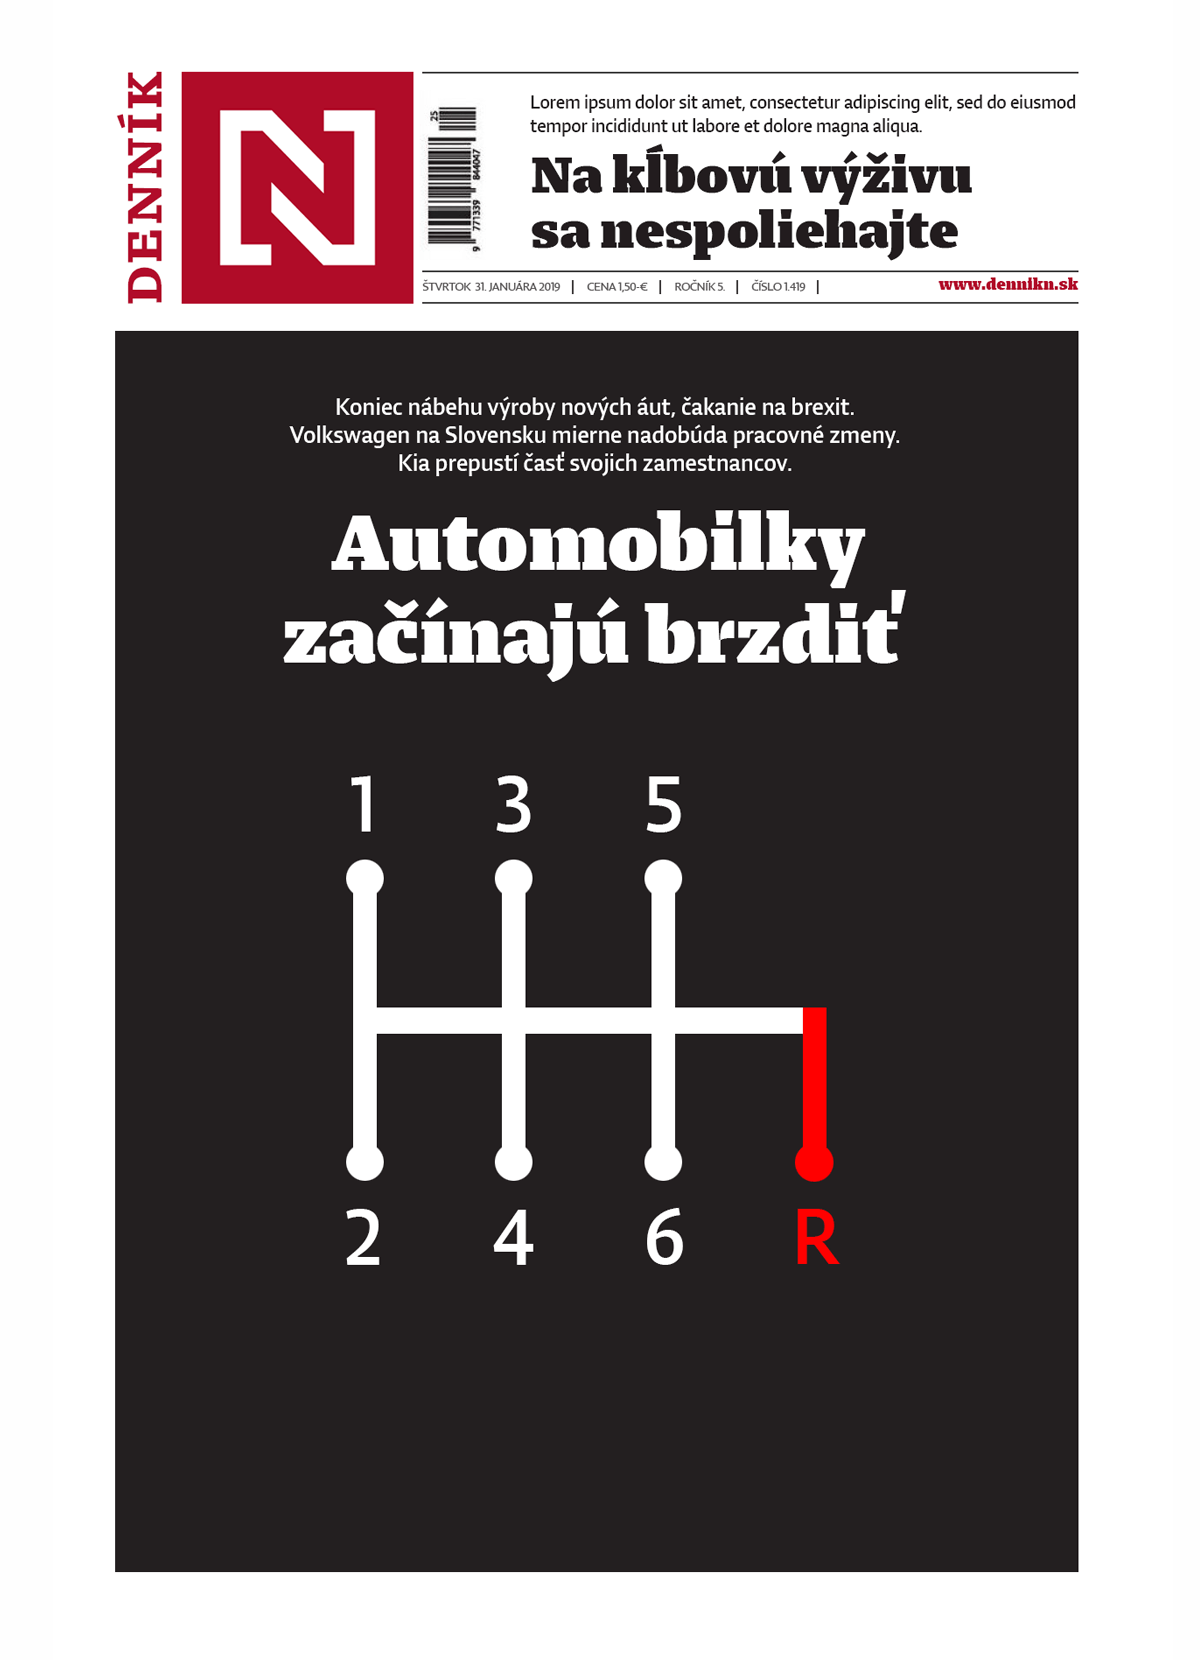
Act 2 - Growth slows down

Well, but we're still the masters

German manufacturers planning alliances for the autonomous car, the threat of brexit and the risk of a new recession in the EU, are slowing sales.

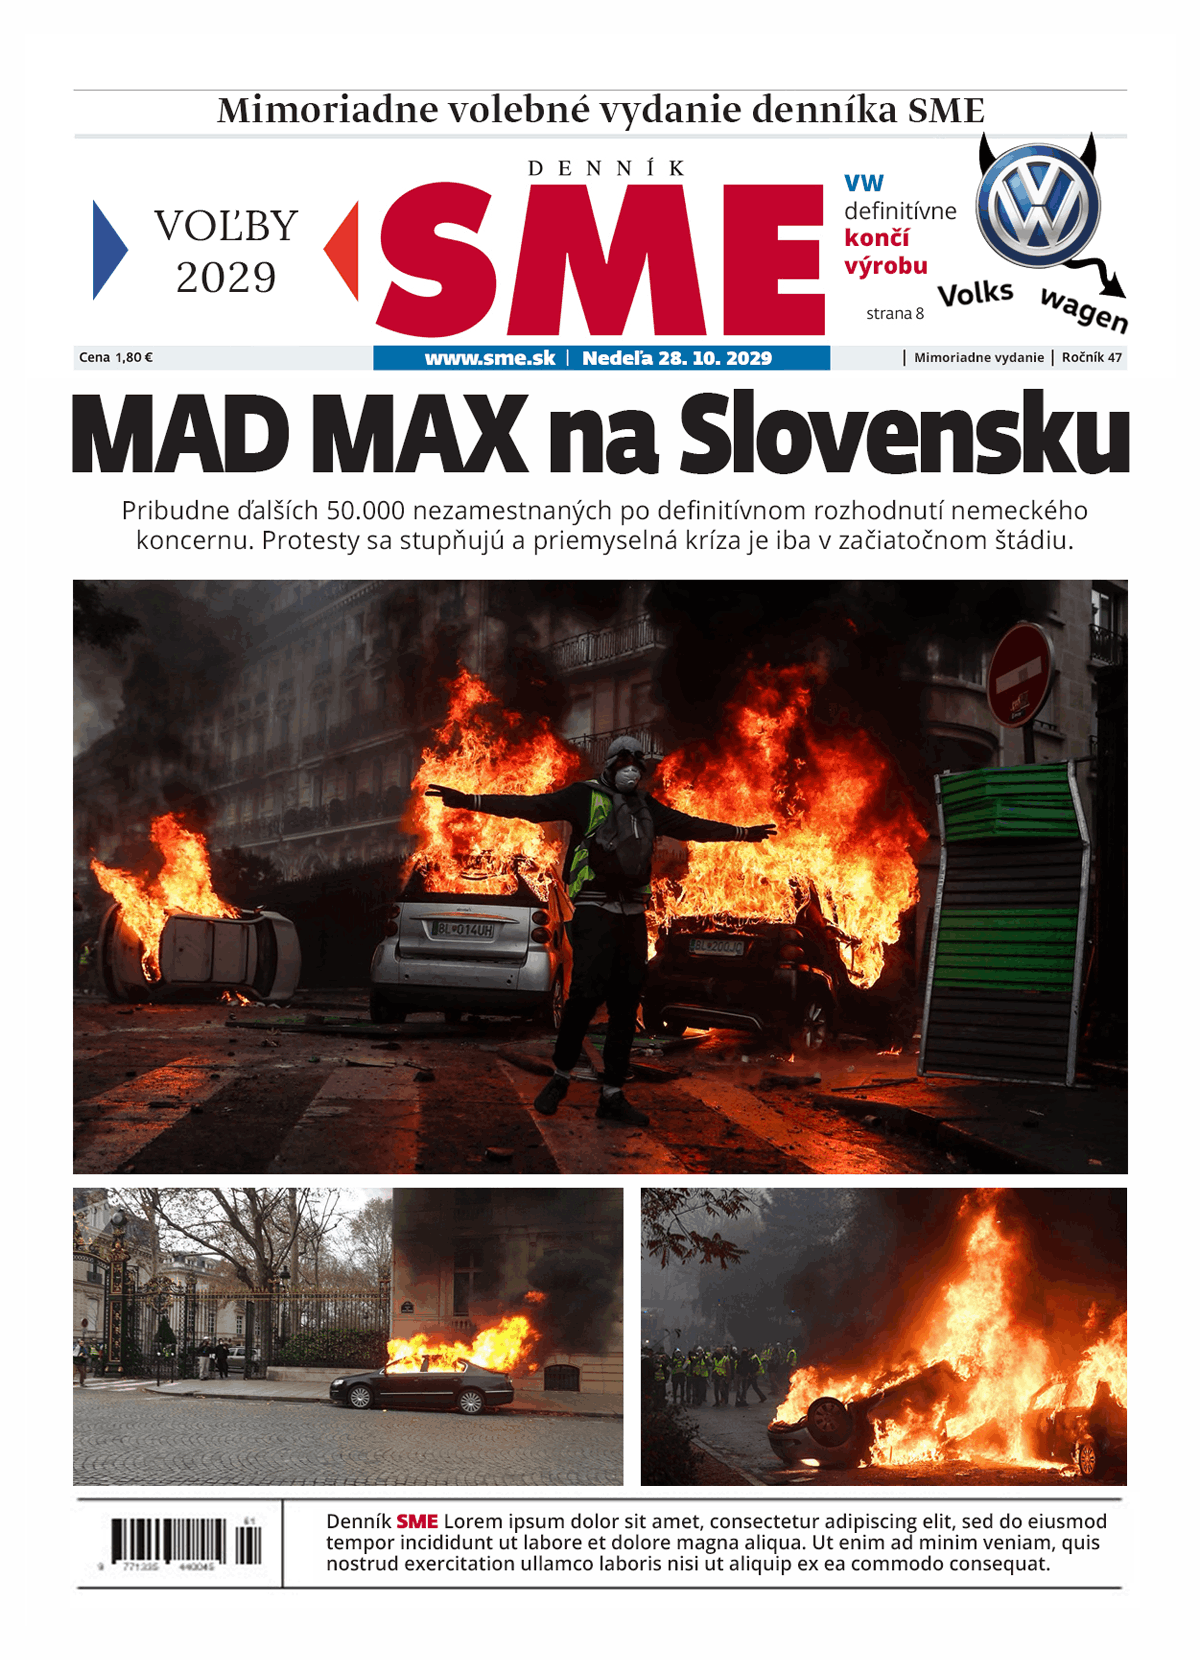
Act 3 - A hard lesson

Autosgang

Not anticipating nor taking actions in a strategic sector that represents almost a quarter of the country's economy, could lead to dramatic consequences.

The impact of Circular Tax and its influence on the industry behavior.

Circular Scorecard

Criterion 1

Industry

Economic indicators regarding the importance and weight of the industry in GDP. Indicators of state strategic sectors.

1
Criterion 2

Risks

Exposure to risk and threats of the future. AI, robotization, automation, IoT and smart computing. Indicators of highly polluting sectors.

2
Criterion 3

Value

High added value creation with both, direct and indirect impact. Investment in innovation and generation of new business models.

3
Criterion 4

Sustainability

Indicators of environmental impact, waste generation and energy consumption. Circular business model implementation.

4
Criterion 5

Personas

Promotes human capital welfare. Indicators of average salary, inclusion, equity and diversity. Training, entrepreneurship and outplacement.

5
Criterion 5

Community

Direct and indirect contribution to the community. Social impact integrated into the business model. Creation of local value chain.

6

New Framework

STANDARD

% 45Tax Rate
  • Maximum Tax rate. The worst scenario due to a poor or negative scoring performance and "standard" business model.

CIRCULAR

New Model
% 15Tax Rate
  • Minimum Tax rate. The best scenario for high added value creating companies and the best performance score supporting circular economy.